Course Project / Medical Image Segmentation
HBA-VAN: Hierarchical Boundary-Aware Volumetric Attention Network for Multi-Modal Glioma Subregion Segmentation
Boundary-aware 3D attention network for multi-modal BraTS glioma subregion segmentation.
BME1312 Artificial Intelligence in Medical Imaging · Course Project · ShanghaiTech University · 2026
BME1312
Overview
This project addresses automatic glioma subregion segmentation from co-registered multi-modal brain MRI. The goal is to predict three clinically meaningful and anatomically nested target regions: whole tumor (WT), tumor core (TC), and enhancing tumor (ET). The portfolio page presents the work as a staged modeling study from 2D slice-wise segmentation to full 3D volumetric reasoning.
Summary
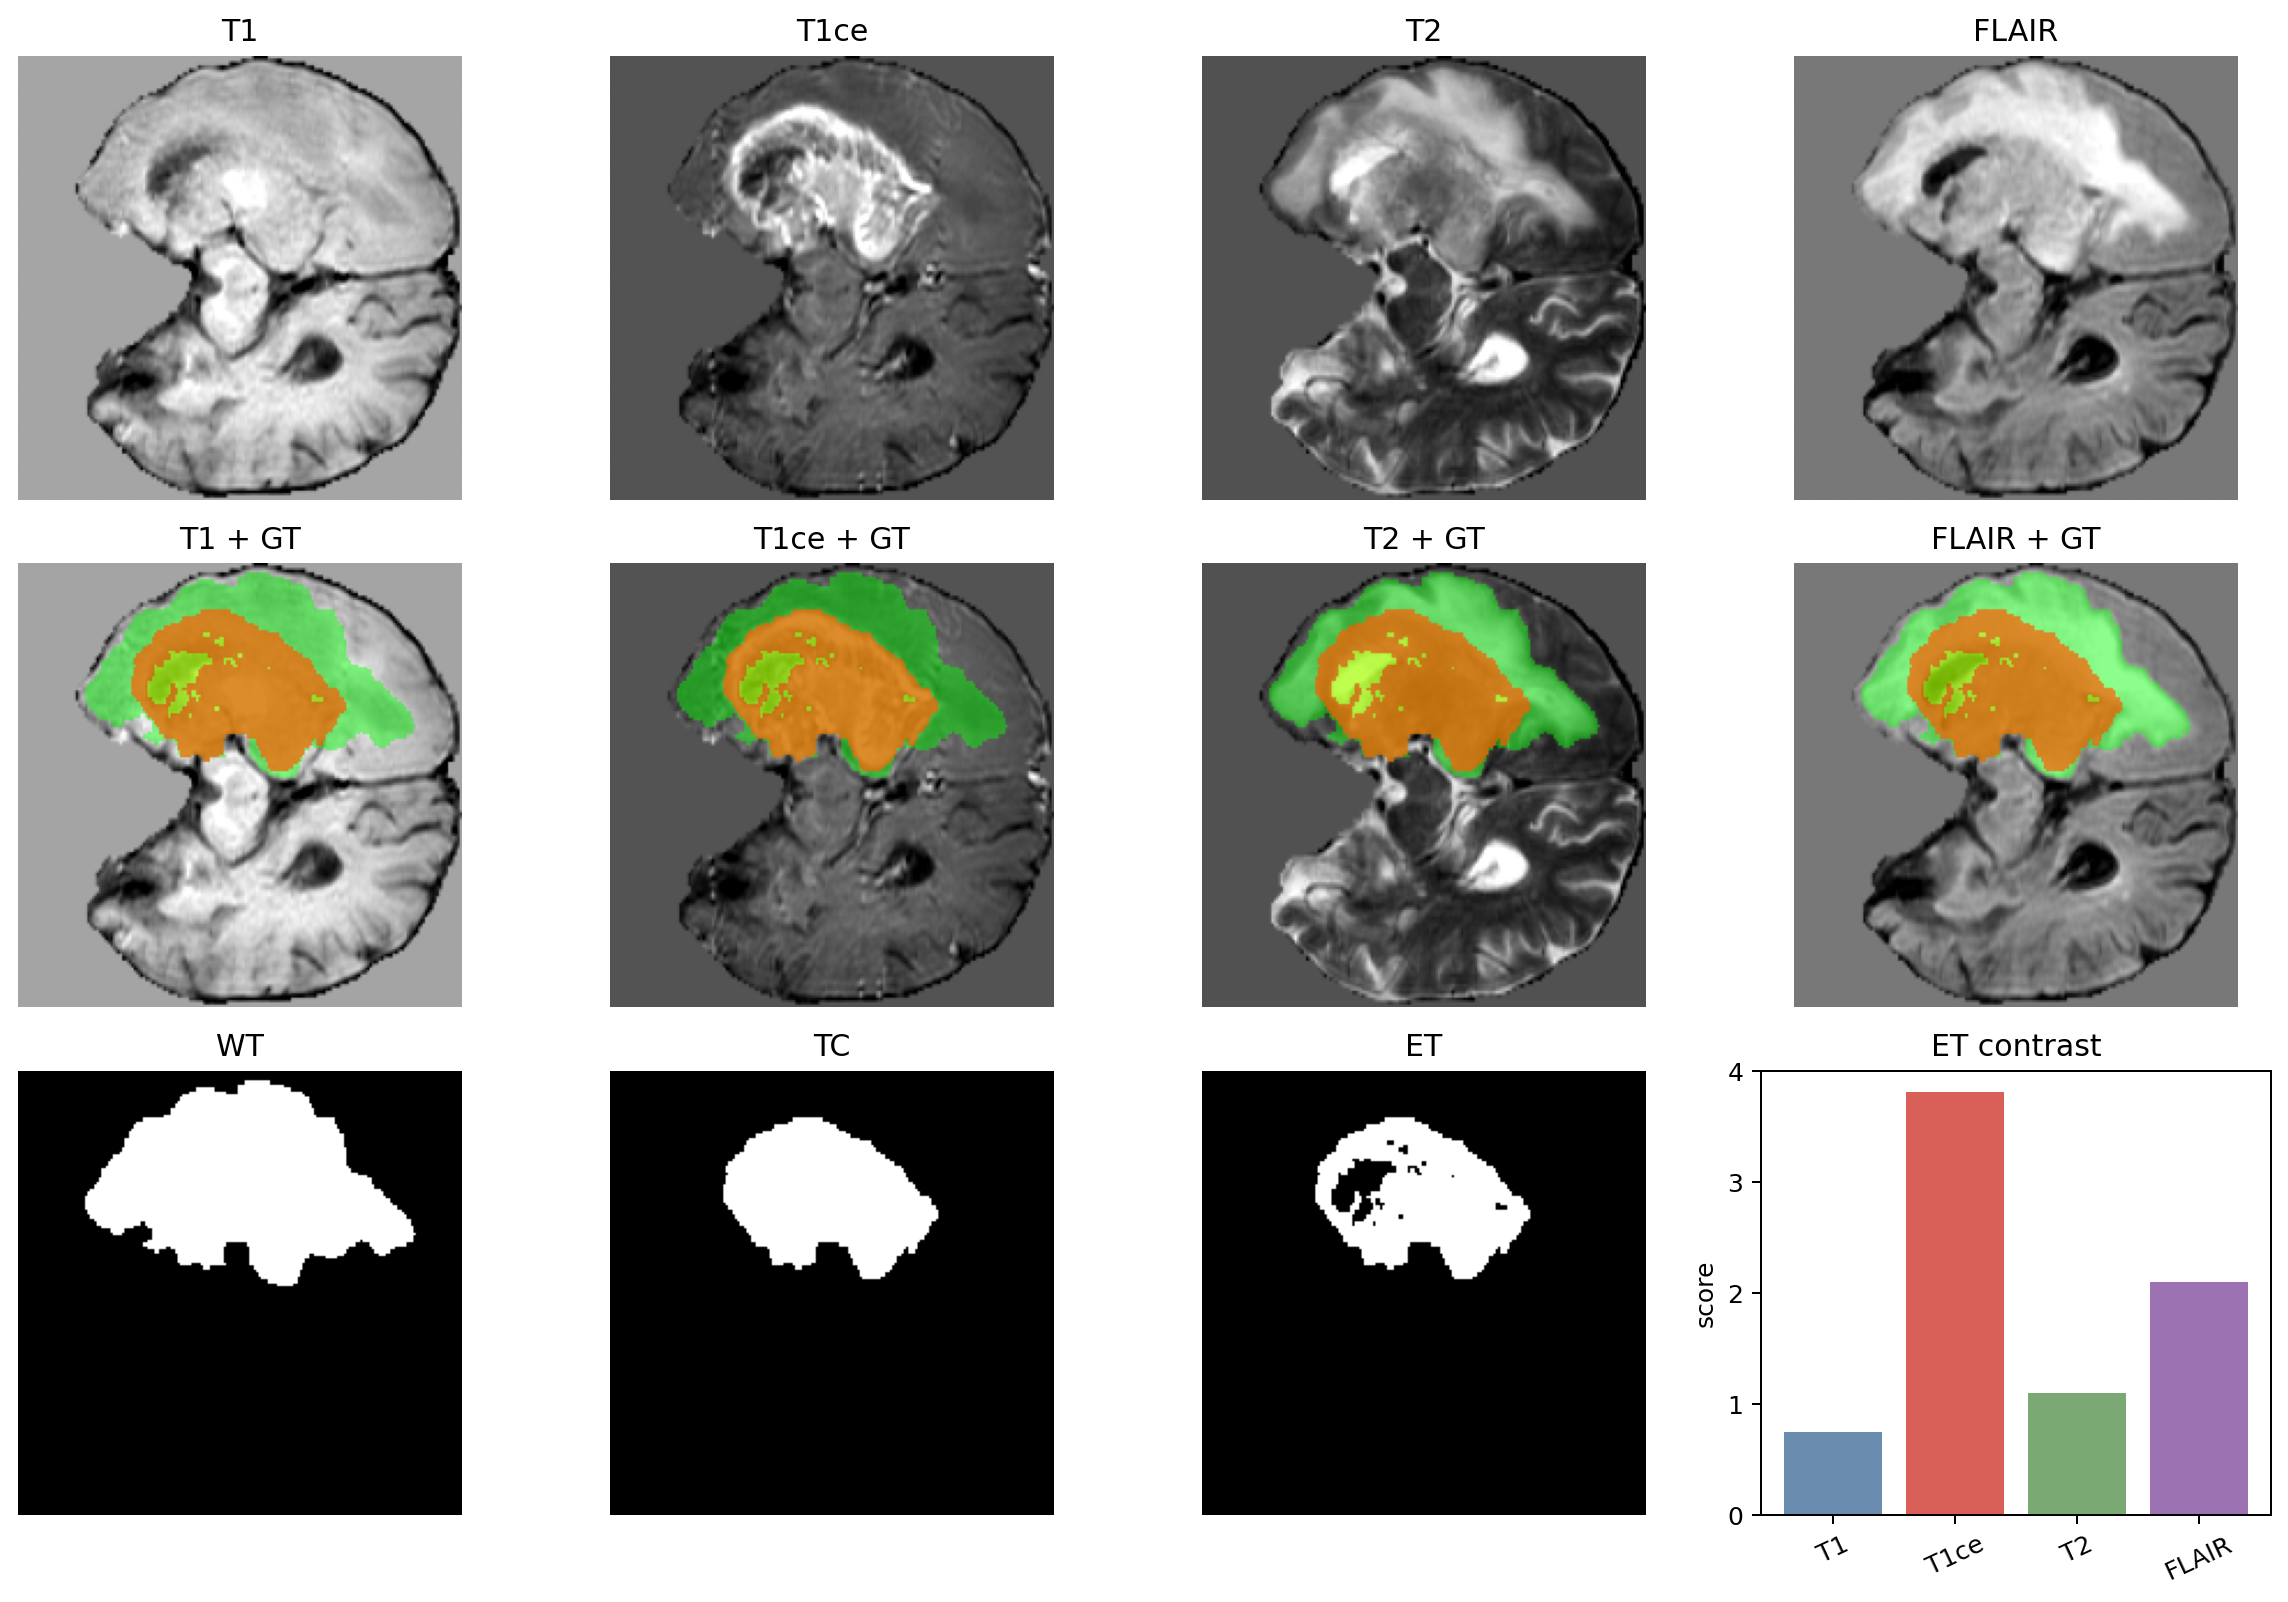
- T1, T1ce, T2, and FLAIR provide complementary signals for tumor extent, core structure, and enhancement.
- WT, TC, and ET form a nested multi-label hierarchy rather than mutually exclusive semantic classes.
- ET is usually small and sparse, producing severe class imbalance and unstable case-level Dice.
- Tumor boundaries are ambiguous, so HD95 and error maps are important alongside overlap metrics.
broad abnormal tumor extent
compact core and boundary-sensitive region
small contrast-dependent enhancing component
Method
The method is organized as a progressive pipeline. Each stage keeps the same WT / TC / ET multi-label task while increasing the amount of through-plane spatial evidence available to the model.
Pipeline
Data preprocessing
- Load co-registered NIfTI volumes for each patient.
- Stack T1, T1ce, T2, and FLAIR as four MRI input channels.
- Crop nonzero brain foreground to reduce redundant background.
- Apply per-modality z-score normalization within brain voxels.
- Construct WT / TC / ET multi-label masks from BraTS-style labels.
- Use patient-level train / validation / test splits to avoid slice leakage.
Pipeline
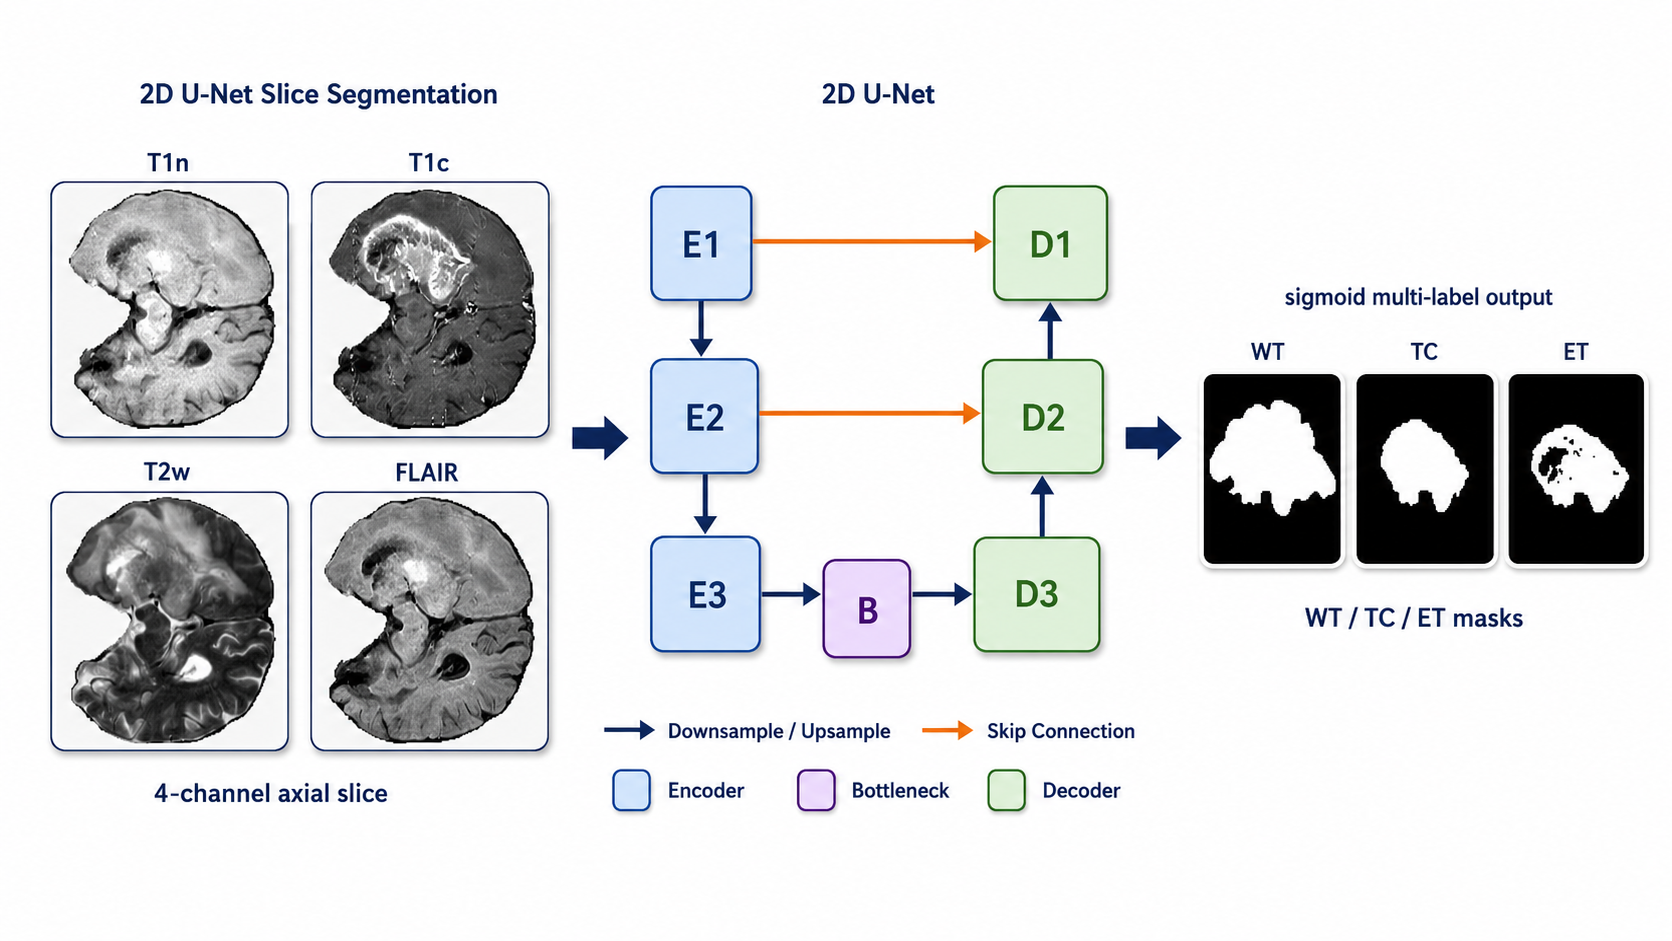
Task2 baseline
- Train a 2D U-Net for slice-wise segmentation.
- Use one axial slice with four MRI modalities as input.
- Predict independent sigmoid masks for WT, TC, and ET.
- Use the 2D model as a strong reference rather than a weak baseline.
Pipeline
Task3 progression
- Introduce 2.5D U-Net variants that use adjacent axial slices as local context.
- Evaluate whether neighboring slices help disambiguate TC and ET boundaries.
- Move from shallow depth context to full 3D volumetric feature learning.
Pipeline
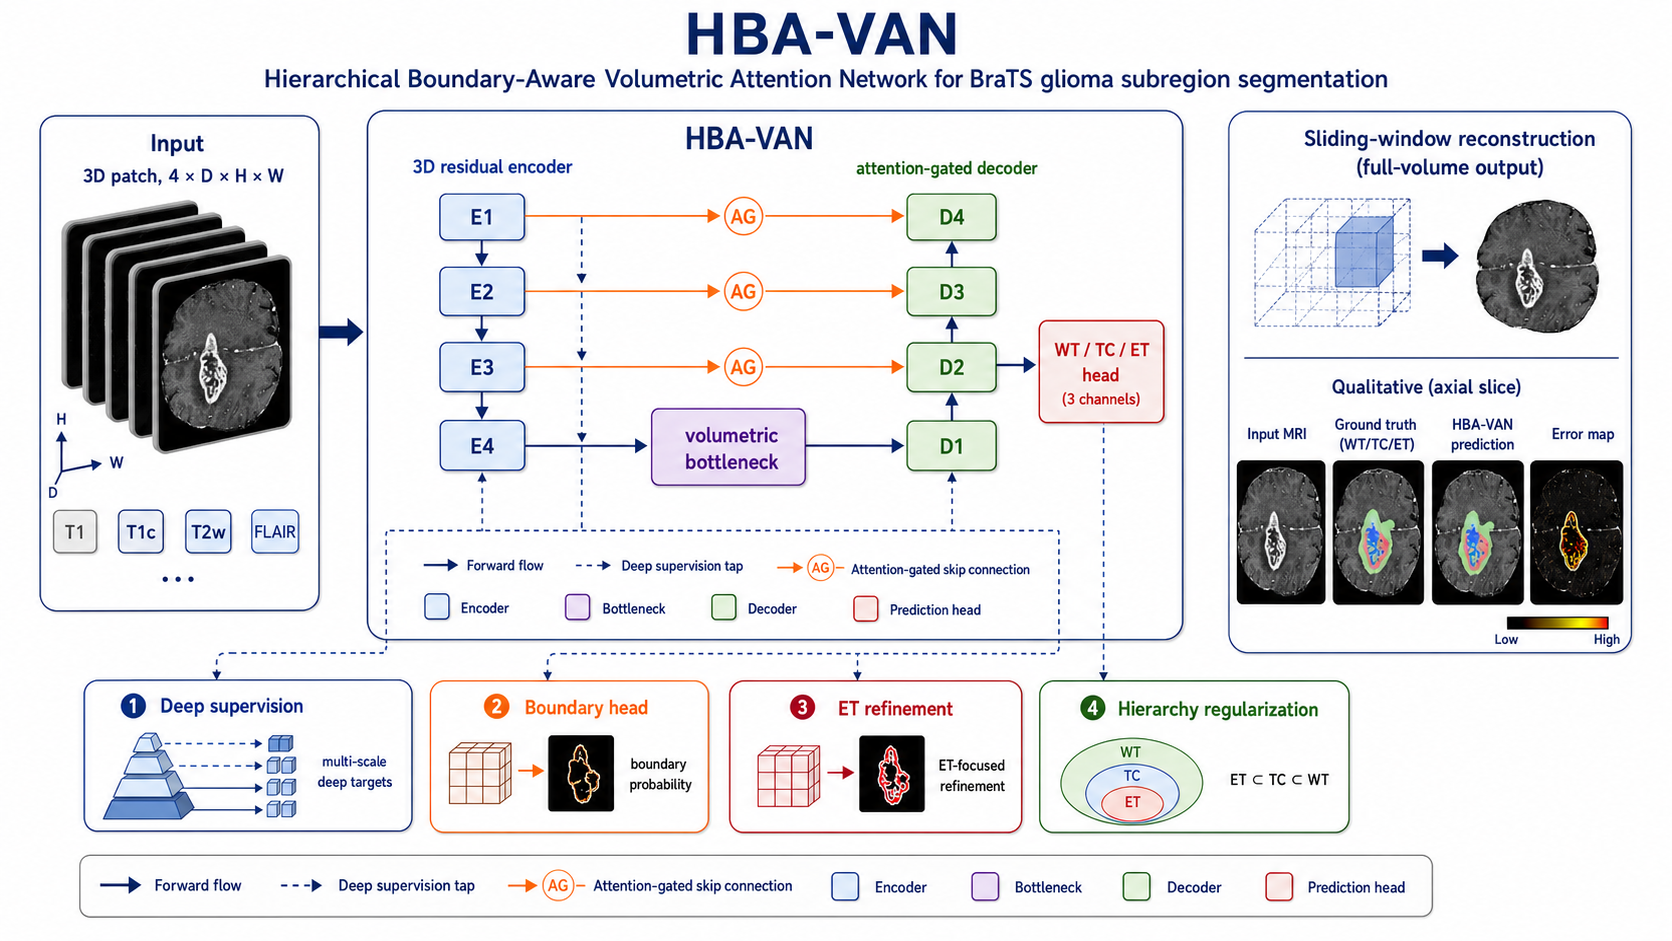
Final model: HBA-VAN
- Use a 3D residual encoder-decoder for volumetric reasoning.
- Apply attention-gated skip fusion, deep supervision, and boundary-aware auxiliary learning.
- Add an ET-specific refinement branch for the smallest subregion.
- Regularize predictions with the hierarchy ET ⊂ TC ⊂ WT.
- Reconstruct full-volume predictions with sliding-window inference.
Key Results
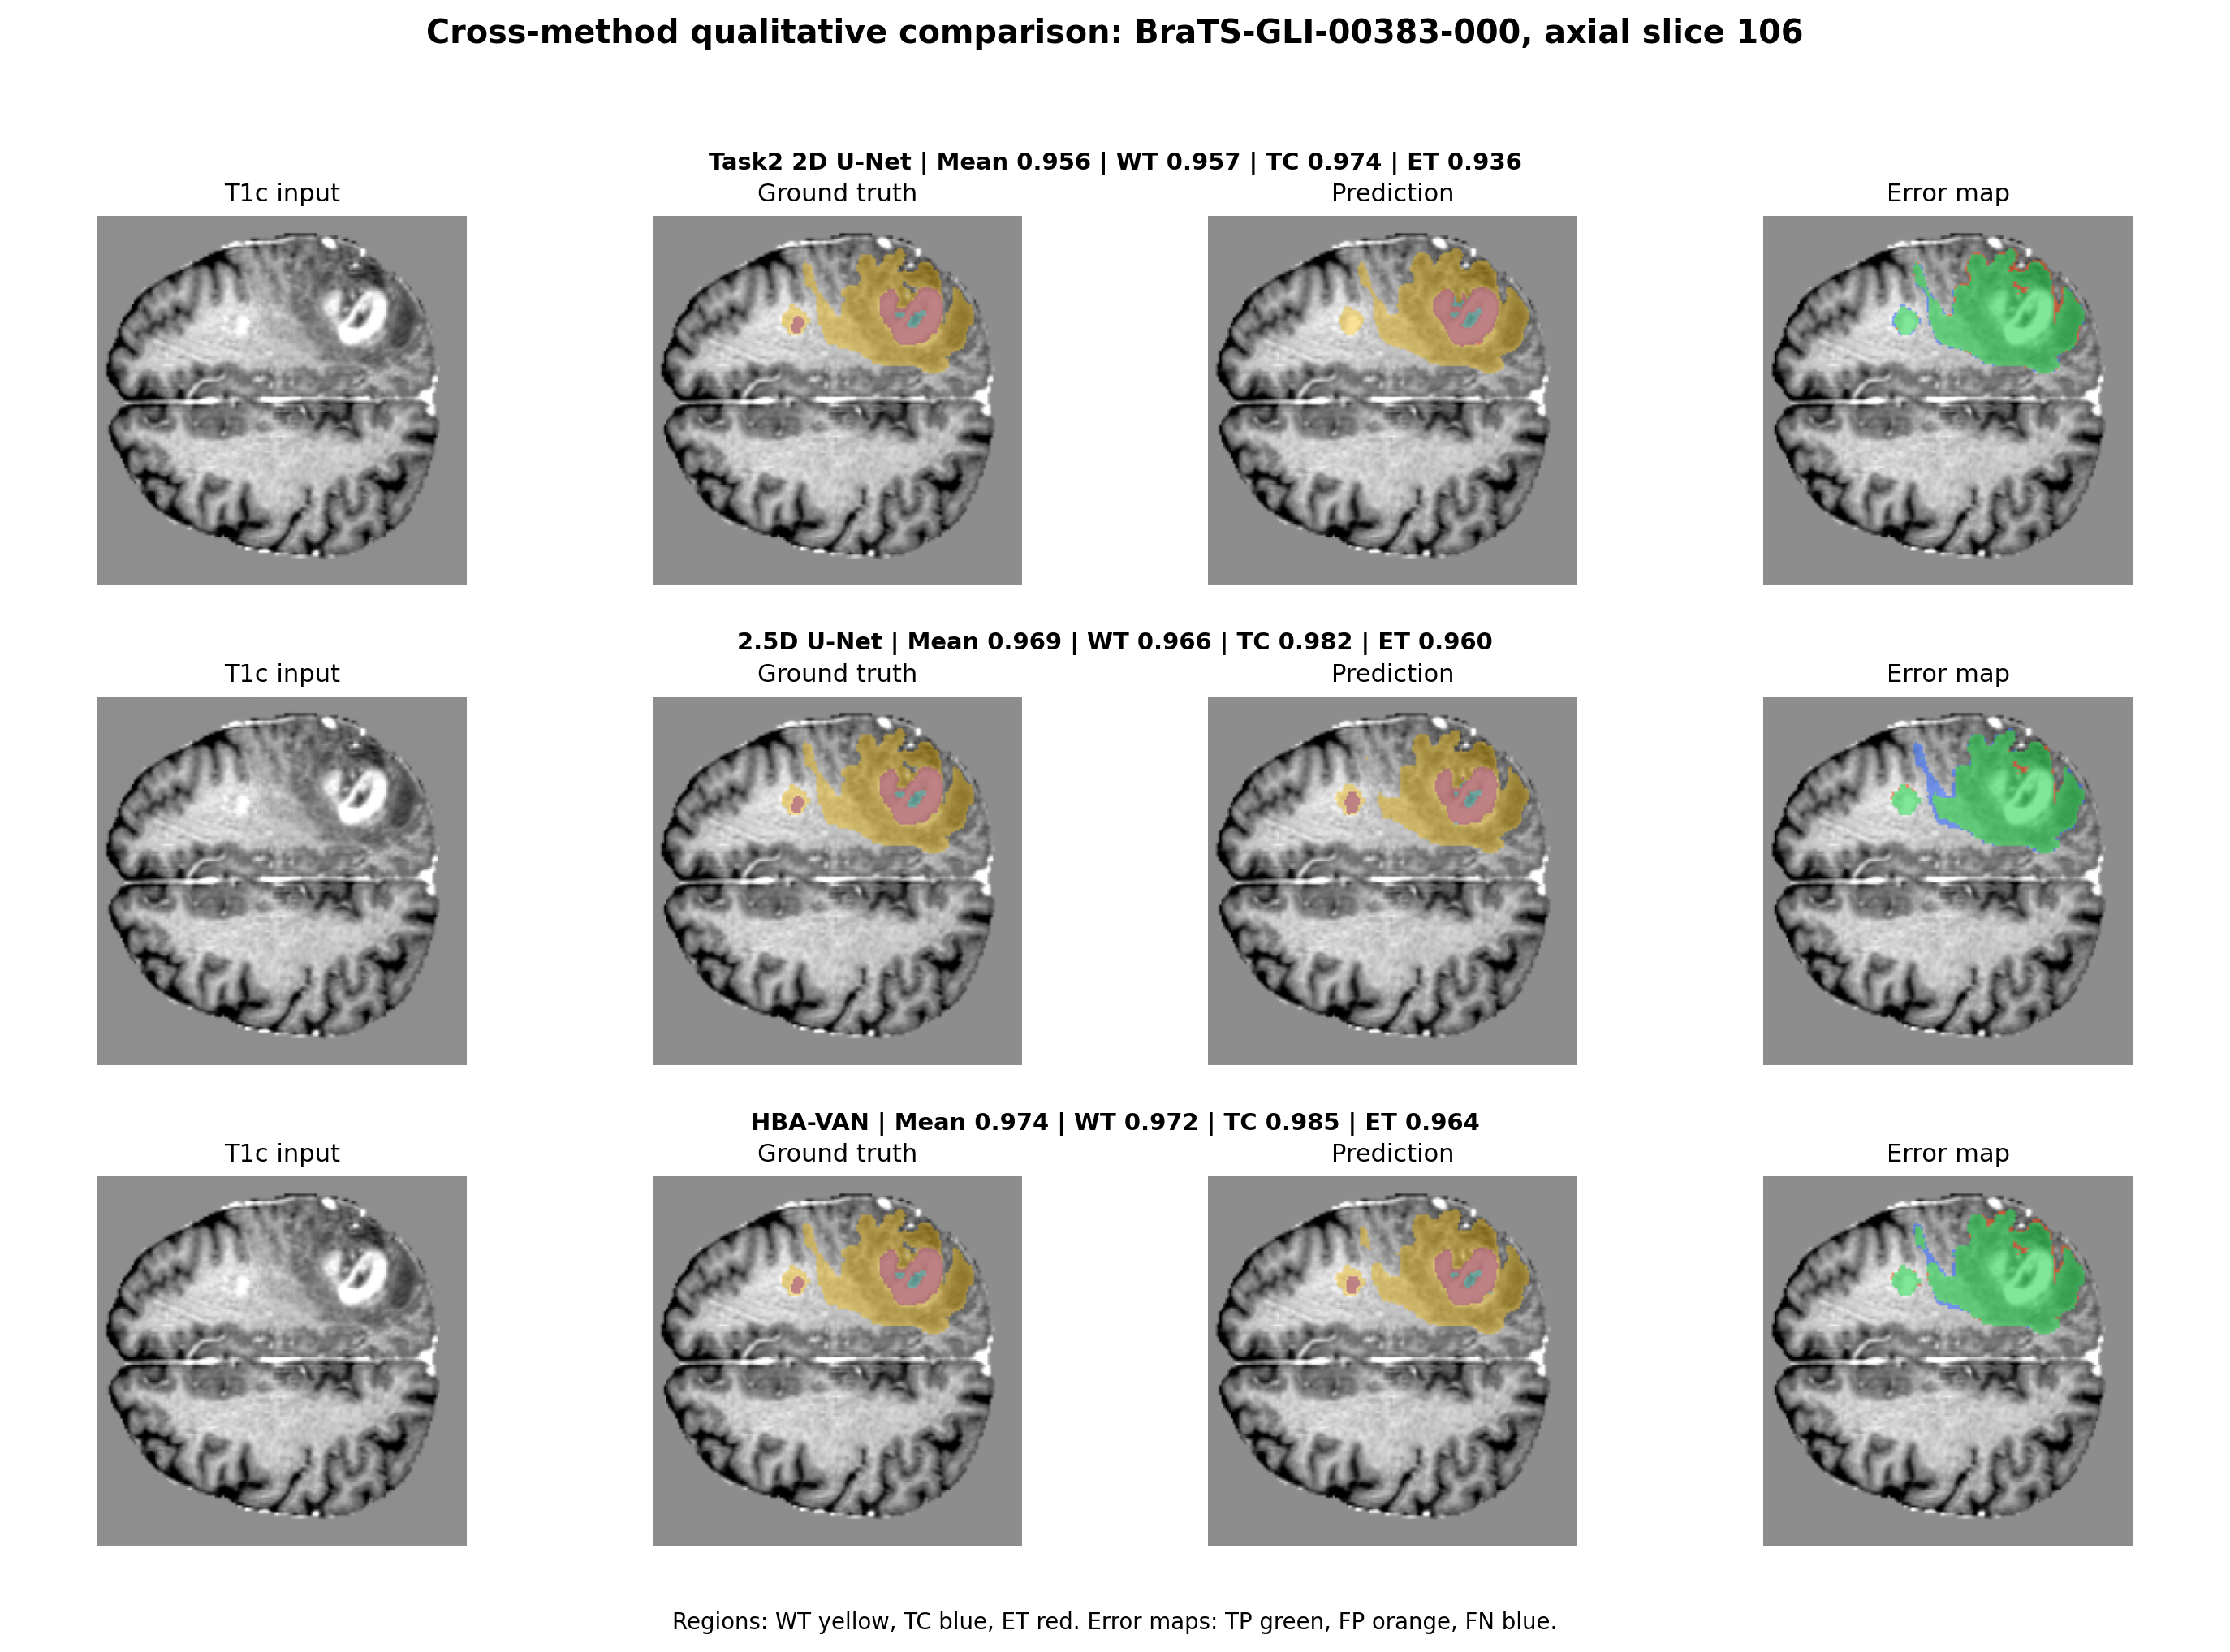
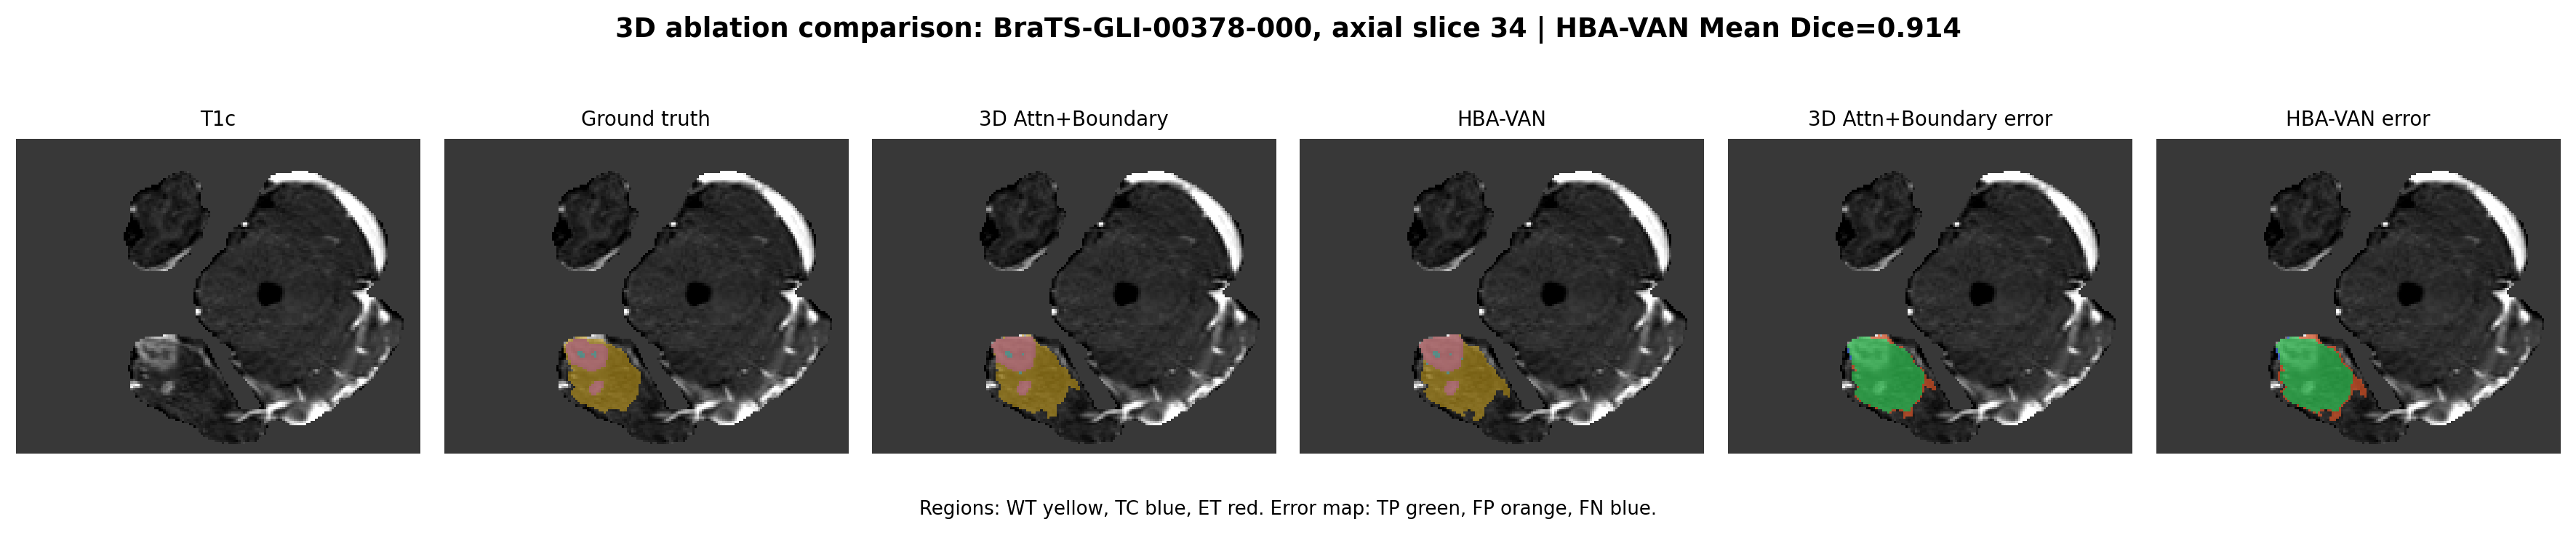
The final 3D HBA-VAN model improves both region overlap and boundary-sensitive evaluation. Compared with the 2D U-Net baseline, mean Dice increases from 0.8962 to 0.9167, while mean HD95 decreases from 6.6879 to 2.8165.
2D U-Net to HBA-VAN
lower boundary error
small enhancing tumor gain
progressive context
Result
- Mean Dice improves from 0.8962 for the 2D U-Net baseline to 0.9167 for HBA-VAN.
- Mean HD95 decreases from 6.6879 to 2.8165, indicating substantially better boundary localization.
- ET Dice improves from 0.8544 in Task2 U-Net to 0.8954 in HBA-VAN.
- The 2.5D model confirms the value of local inter-slice context, while full 3D modeling provides the best overall result.
Visuals
The figures below are cropped and web-optimized from the report and presentation materials, focusing on the actual diagrams and qualitative results rather than full-page screenshots.
My Contribution
- Contributed to the final project report and presentation material organization.
- Participated in result interpretation and qualitative analysis.
- Helped summarize the model design, experimental findings, and medical-imaging motivation.
- Integrated the project into a reproducible academic portfolio format.
Links and Assets
The original report and presentation slides are provided as static portfolio assets. No code link is shown because no public repository was provided for this project.
This was a team course project for BME1312 Artificial Intelligence in Medical Imaging. The webpage summarizes the technical work without displaying teammate student IDs, email addresses, or other unnecessary personal identifiers.