Course Project / Probability Theory
Reverse Engineering the Mechanism of WeChat Red Envelope
A probability modeling and statistical testing project that infers candidate allocation mechanisms from controlled WeChat Red Envelope data.
SI140A Probability Theory · Course Project · ShanghaiTech University · January 2026
SI140A
Overview
This project studies whether the probabilistic allocation behavior of WeChat Red Envelope can be inferred from real experimental observations. Under a controlled data-collection protocol, we collected allocation records, visualized the empirical distribution, designed candidate probabilistic mechanisms, and compared the simulated mechanisms with observed data using formal goodness-of-fit tests.
Summary
- The project is framed as a probability modeling and statistical inference study rather than a routine programming assignment.
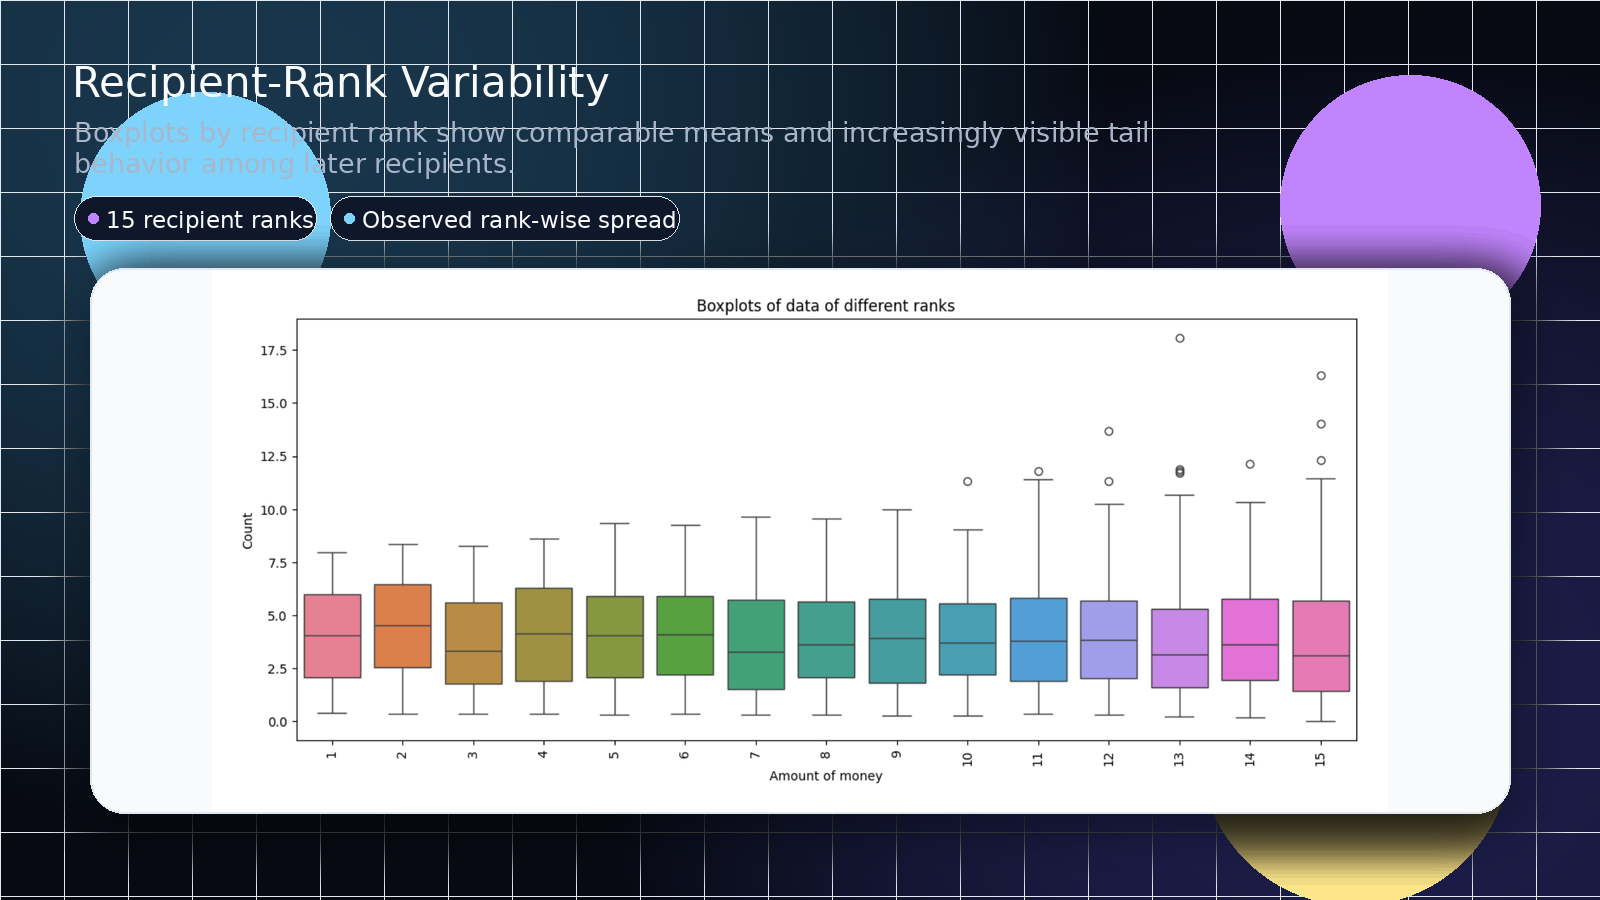
- Empirical plots are used to identify distributional patterns across recipient ranks and total allocation samples.
- Candidate mechanisms are evaluated by Monte Carlo simulation and statistical tests against the observed allocation frequency.
- The analysis suggests that the Twice-as-the-Mean mechanism better matches the observed WeChat Red Envelope behavior.
Experimental Setting
fixed total allocation
people per red envelope
controlled experiment rounds
allocation observations
Methodology
The methodology combines empirical visualization, analytic mechanism design, simulation-based approximation, and hypothesis testing. The goal is not to exactly reproduce the implementation inside WeChat, but to determine which transparent probabilistic model is most consistent with the collected evidence.
Method
Data processing and visualization
- Cleaned the allocation records into rank-wise and global samples.
- Examined histograms, boxplots, and scatter plots to summarize distributional behavior.
Method
Candidate mechanism design
- Formulated allocation rules with equal expected value across ranks.
- Derived expectation and variance properties for candidate mechanisms.
Method
Monte Carlo simulation
- Generated synthetic allocation samples under each candidate mechanism.
- Estimated theoretical frequency distributions for comparison with real data.
Method
KS and Chi-square tests
- Applied the Kolmogorov-Smirnov test to compare sample distributions.
- Applied a Chi-square test after frequency bin merging for expected-count validity.
Method
Model comparison
- Compared test statistics, p-values, and visual distributional patterns.
- Selected the mechanism with stronger empirical alignment and smaller deviations.
Candidate Models
Two primary candidate mechanisms were tested. The page summarizes their modeling ideas without reproducing the full derivations from the report.
Model
Gamma-Dirichlet Split
- Samples allocation proportions through a Gamma / Dirichlet construction.
- Uses a concentration parameter to control variance while preserving target expectations.
- Provides analytic convenience, but its fitted distribution deviated significantly from the observed data.
Model
Twice-as-the-Mean Mechanism
- Sequentially allocates a random amount bounded by twice the current remaining mean.
- Keeps the expected value approximately balanced across recipient ranks.
- Naturally produces larger variance for later recipients, matching a key empirical pattern.
Key Findings
The empirical and simulation results point to a clear qualitative conclusion: the Twice-as-the-Mean mechanism is closer to the observed WeChat Red Envelope distribution, while Gamma-Dirichlet Split produces a visibly and statistically different allocation pattern.
Conclusion
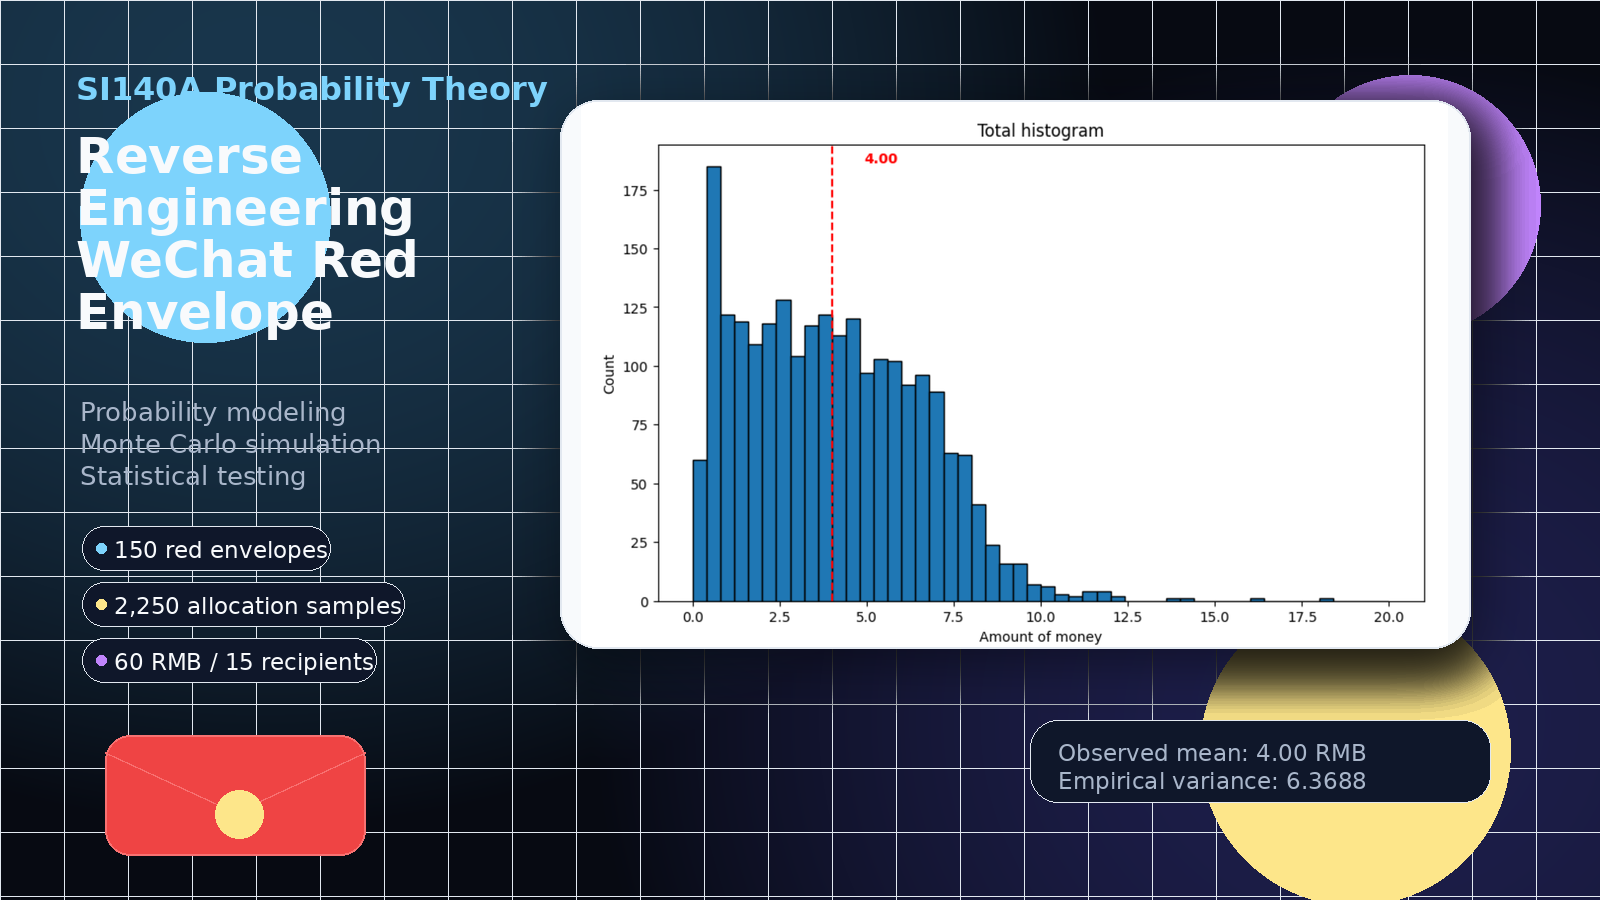
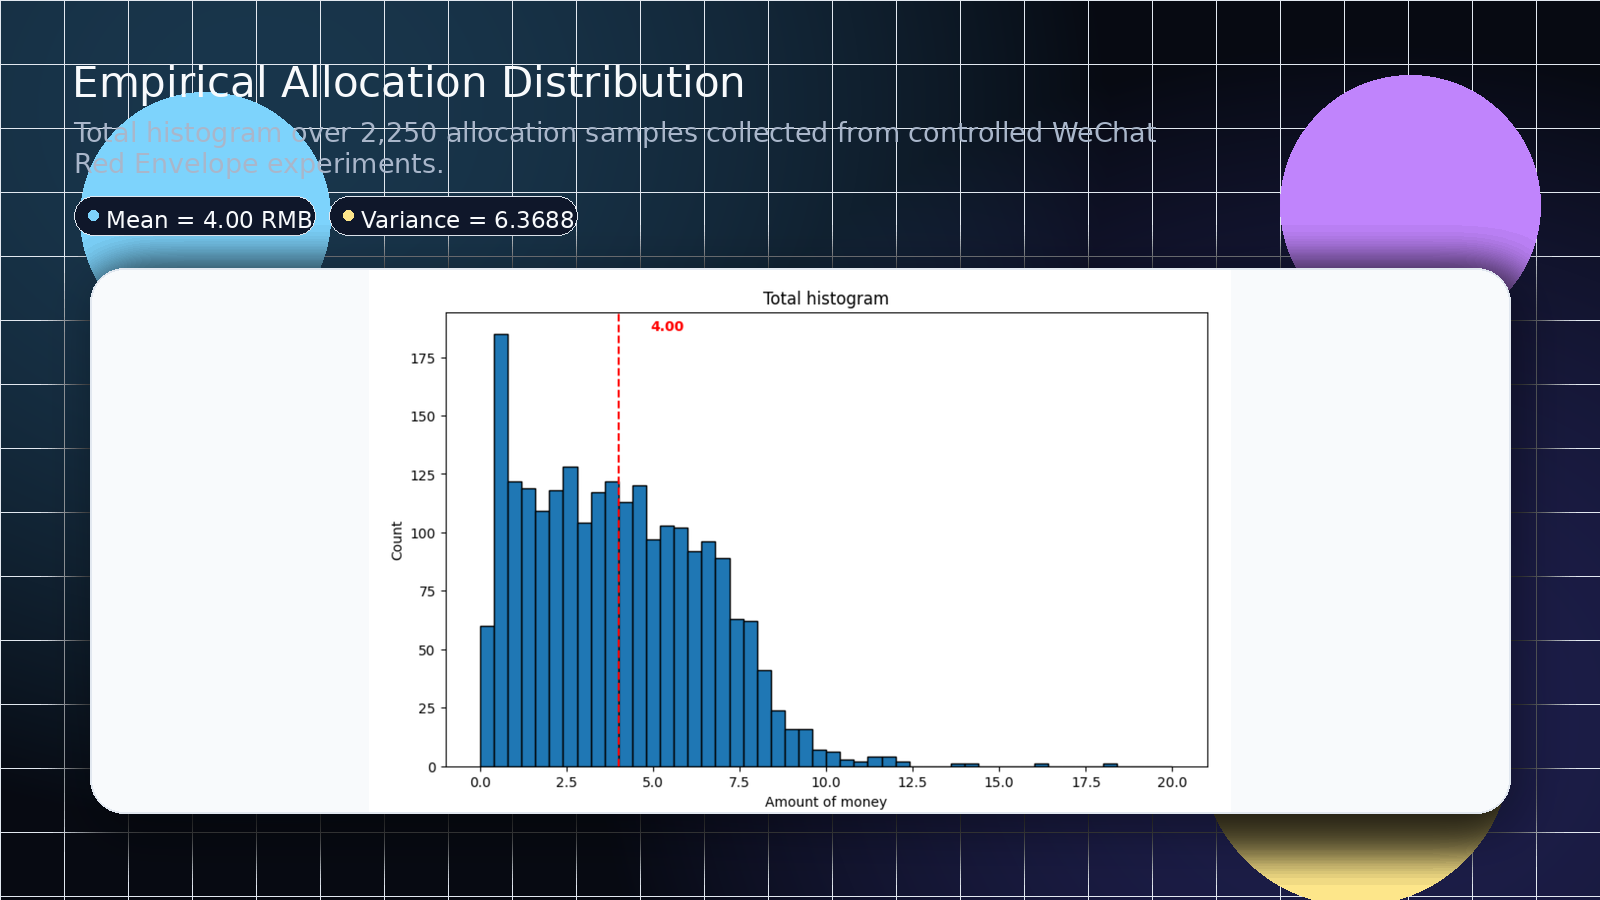
- All recipient ranks have roughly similar expected values, with an overall empirical mean of 4.00 RMB.
- Later recipient ranks exhibit larger variance and more extreme high-value observations.
- Gamma-Dirichlet Split differs significantly from the observed allocation frequency under both tests.
- Twice-as-the-Mean passes the KS test at the 5% level and has a much smaller Chi-square deviation than Gamma-Dirichlet Split.
- Further explorations considered user-specific allocation mechanisms and fairness-aware red envelope designs.
My Contribution
Contribution
- Derived and verified the expectation and variance of candidate mechanisms.
- Organized and coordinated the experiment.
- Contributed to part of the implementation.
- Verified simulation results and statistical conclusions.
Visuals
The figures below are web-optimized visuals extracted and redesigned from the project report, preserving the empirical histogram and rank-wise boxplot analysis without showing full PDF pages.
Links
The full report contains the complete derivations, simulation code excerpts, statistical tests, and appendix materials. No code repository is linked because no public repository was provided for this project.
The PDF is provided as the original course report; the portfolio page intentionally omits raw teammate student IDs and other unnecessary personal identifiers.